Set up Prometheus to monitor running replications #
Arcion On-premises UI exposes a Prometheus metrics data endpoint. This allows you to use Prometheus and Grafana to collect and visualize metrics about your ongoing replications. Our Prometheus integration collects metrics from configured targets at given intervals and displays the results.
Requirements #
- A running instance of Prometheus server to scrape the data. To set up a working instance, follow the instructions in Prometheus installation docs.
- An Arcion On-premises UI Docker container.
- A PostgreSQL database for Arcion On-premises UI metadata.
- Optionally, an instance of a data visualization tool of your choice. This example uses Grafana.
Configure Arcion On-premises UI to expose Prometheus endpoint #
The following Docker compose file spins up a Prometheus server, a Grafana instance, a PostgreSQL container, and a Replicant on-premises container. Make sure to enter the corresponding credentials and variables for your setup into the Compose file before you use it.
version: '3.8'
services:
  prometheus:
    image: prom/prometheus:v2.47.0
    container_name: prometheus
    ports:
      - 9090:9090
    volumes:
      - '<YOUR_INTERNAL_PATH>/prometheus.yml:/etc/prometheus/prometheus.yml'
    networks:
      arcion:
        aliases:
          - prometheus
  grafana:
    image: grafana/grafana:9.4.7
    container_name: grafana
    ports:
      - 3000:3000
    networks:
      arcion:
        aliases:
          - grafana
  postgres:
    image: postgres:14-alpine
    container_name: postgres
    ports:
      - 5432:5432
    environment:
      - 'POSTGRES_PASSWORD=postgres'
    networks:
      arcion:
        aliases:
          - postgres
  replicant-on-premises:
    image: arcionlabs/replicant-on-premises:latest
    container_name: replicant-on-premises
    ports:
      - 8080:8080
      - 8050:8050
    environment:
      - 'DB=POSTGRESQL'
      - 'DB_HOST=postgres'
      - 'DB_PORT=5432'
      - 'DB_DATABASE=postgres'
      - 'DB_USERNAME=postgres'
      - 'DB_PASSWORD=postgres'
      - 'PROMETHEUS_ENABLE=true'
      - 'ARCION_LICENSE=Base64 encoded license'
    depends_on:
      - postgres
    networks:
      arcion:
        aliases:
          - replicant-on-premises
    extra_hosts:
      - 'host.docker.internal:host-gateway'
networks:
  arcion:
Environment variables #
In the preceding Compose file, the PROMETHEUS_ENABLE environment variable enables or disables Prometheus endpoint.
By default, the preceding configuration exposes the Prometheus metrics endpoint at http://localhost:8050/prometheus/metrics on port 8050.
Usage #
Prometheus #
-
Make sure you have setup a running replication in the UI. Navigate to
http://localhost:8050/prometheus/metricsand you should see the metrics output in your browser. -
Access the Prometheus server at
http://localhost:9090and configure the metrics endpoint as a target. The following example shows aprometheus.ymlscraping configuration:global: scrape_interval: 60s # By default, scrape targets every 15 seconds. # A scrape configuration containing exactly one endpoint to scrape: # Here it's Prometheus itself. scrape_configs: # The job name is added as a label `job=<job_name>` to any timeseries scraped from this config. - job_name: 'replicant-on-premises' # Override the global default and scrape targets from this job every 5 seconds. scrape_interval: 30s metrics_path: '/prometheus/metrics' scheme: http static_configs: - targets: ['prometheus:8050']After starting Prometheus with the preceding configuration, open
http://localhost:9090in your browser. To make sure that Prometheus properly scrapes the data, select Targets in the Status menu from the top menu bar. The Targets page displays important scrape-related information for all active targets: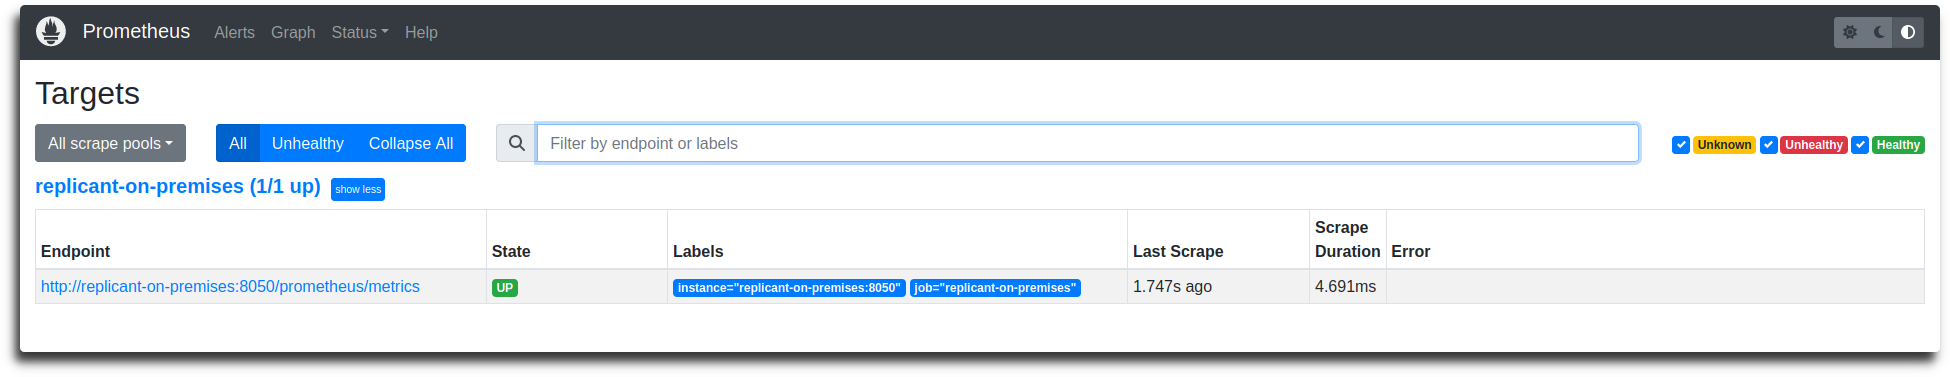
Grafana #
-
Log into Grafana at
http://localhost:3000. The default username and password for Grafana are admin and admin. -
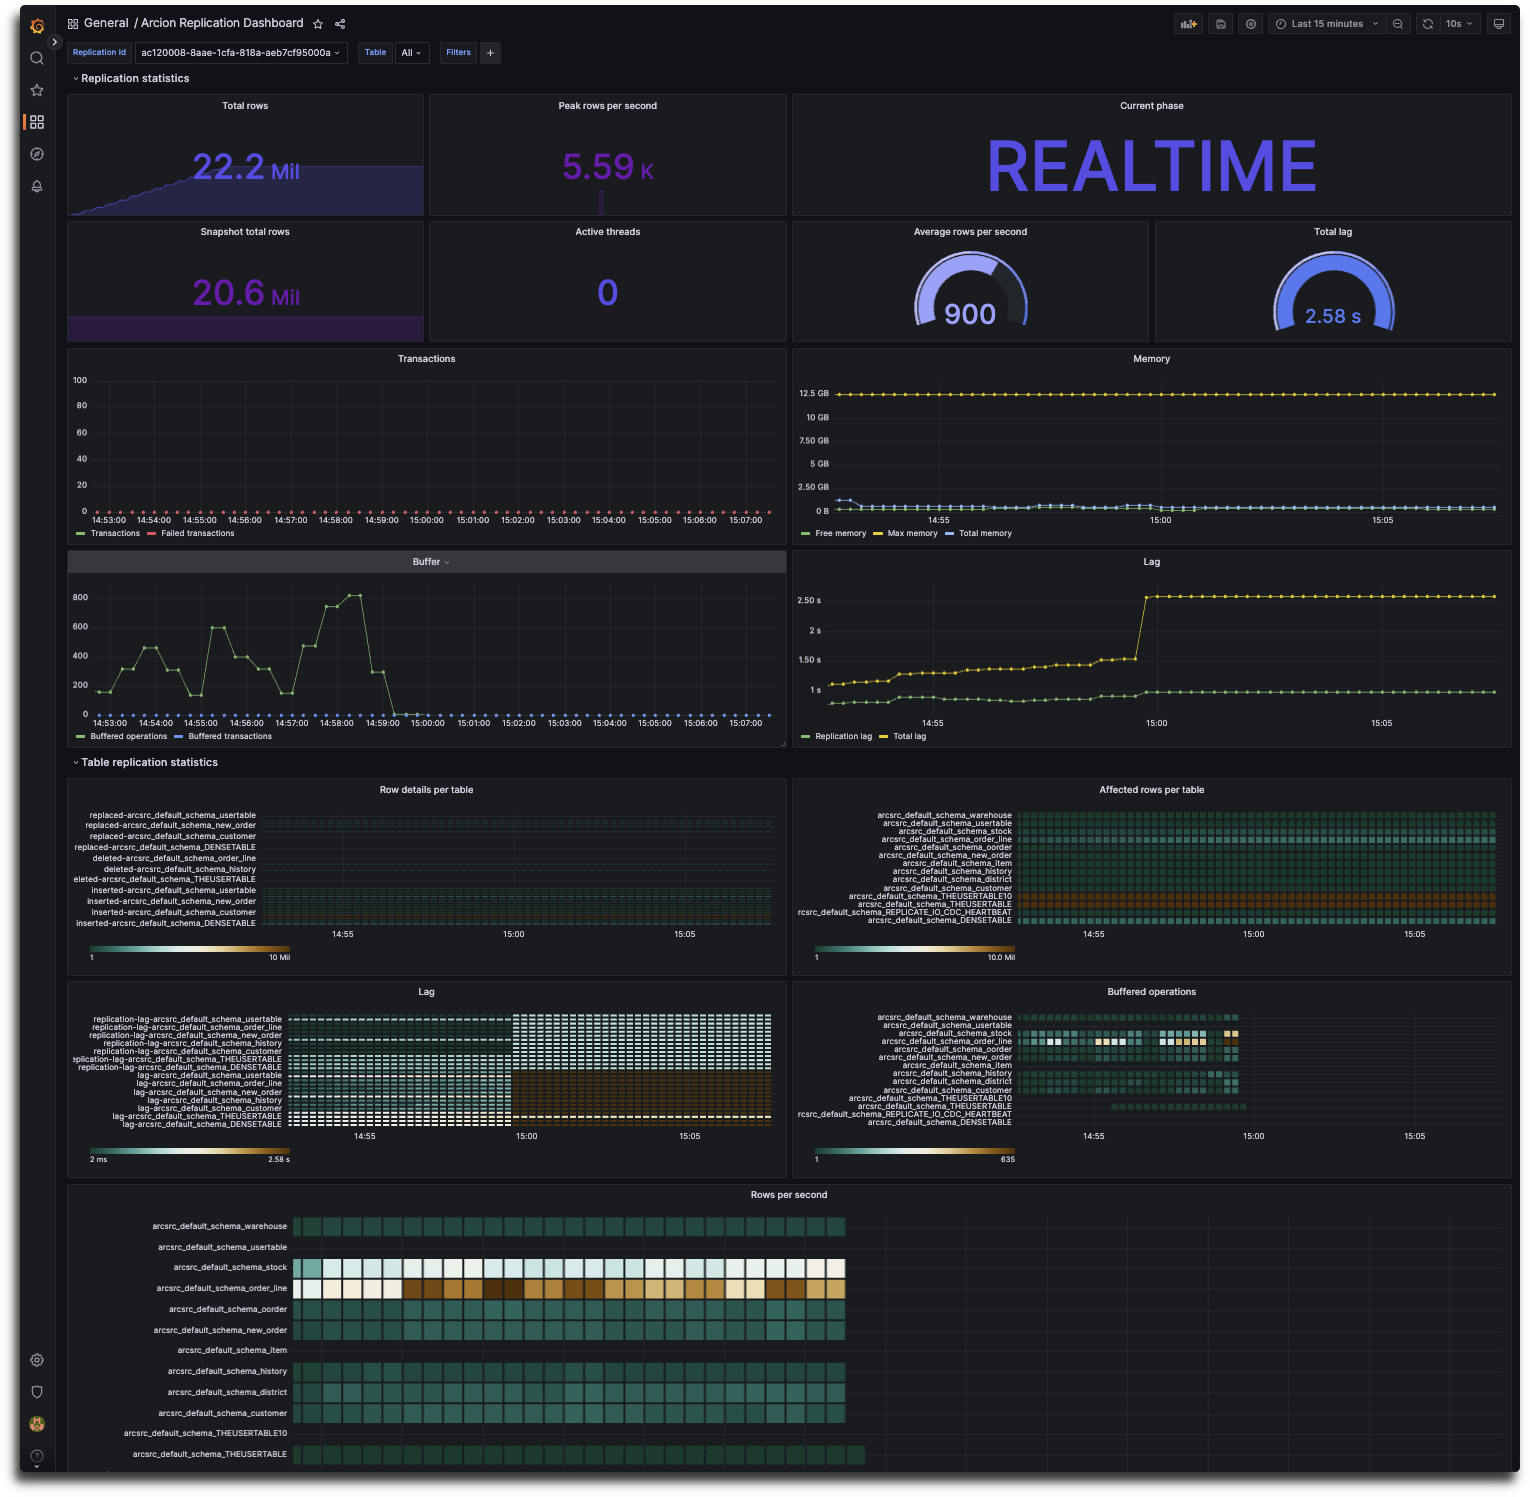
You can create your own Dashboard or use our example dashboard.